
THE 2017 REPORT
The market strategists at WeBuyHouses.com® – one of the nation’s largest networks of residential real estate investors – see continued strength in the U.S. housing market through 2017. Market conditions should be favorable for participants in the residential housing industry – including builders, brokers/agents, investors, and lenders.
“We consider three key indicators – (1) housing starts, (2) existing home sales, and (3) investments in home renovations – and all three indicators continue to show strong demand for existing housing and increasing supply for new housing ,” explained Dev Horn, VP of Marketing for WeBuyHouses.com. “The market through 2016 has leveled off a bit, the curves have been flattening out. We see continued strength – but also continued supply constraints – in the housing market in 2017.”
WeBuyHouses.com® CEO Jeremy Brandt added, “The housing market was strong in 2016, just as we predicted last year. The market will remain very healthy in 2017, which is good news for everyone involved in real estate. Housing demand was well ahead of housing supply for the past few years, and we believe those inventory constraints will continue through 2017. But the fact that some of the housing trends have leveled off could be an indication that the gap between supply and demand may narrow a bit in 2017. We think this will be a positive for both investors and agents/brokers.”
KEY TAKE-AWAYS FOR REAL ESTATE PROFESSIONALS:
In an appreciating market, home sellers get unrealistic expectations. It’s better for investors (and agents as well) if home sellers have a more rational set of expectations. A “leveling off” of key housing indicators through 2017 is likely, and it would be is a healthy step that could help us avoid a housing bubble. Higher mortgage interest rates in 2017 could help to cool the market (demand) just a bit. A less frothy market would be better for real estate professionals.
However, even if the housing market moves toward equilibrium, constraints on supply will continue in 2017, causing home prices to continue to edge up in most urban and suburban markets in the U.S..
Let’s take a look at the data ~
NEW HOUSING STARTS
As we go press with this report, October 2016 data is coming out that shows a sharp increase in housing starts in both single- and multi-family units. According to the Wall Street Journal (11/14/2016):
Housing starts rose 25.5% in October to a seasonally adjusted annual rate of 1.323 million, the Commerce Department said Thursday, as multifamily housing starts came back with a vengeance. That was the highest pace since August 2007.
Single-family starts also continued to climb, reaching a rate of 869,000, another nine-year high.
The larger-than-expected gains across all regions “reaffirm our view that steady improvement in the housing market is likely to continue over the next two years,” said Rob Martin of Barclays Bank PLC.
Housing starts in multi-family are outshining the rise in single-family, but we see continued strength in both based upon the trend over the past 12 months:
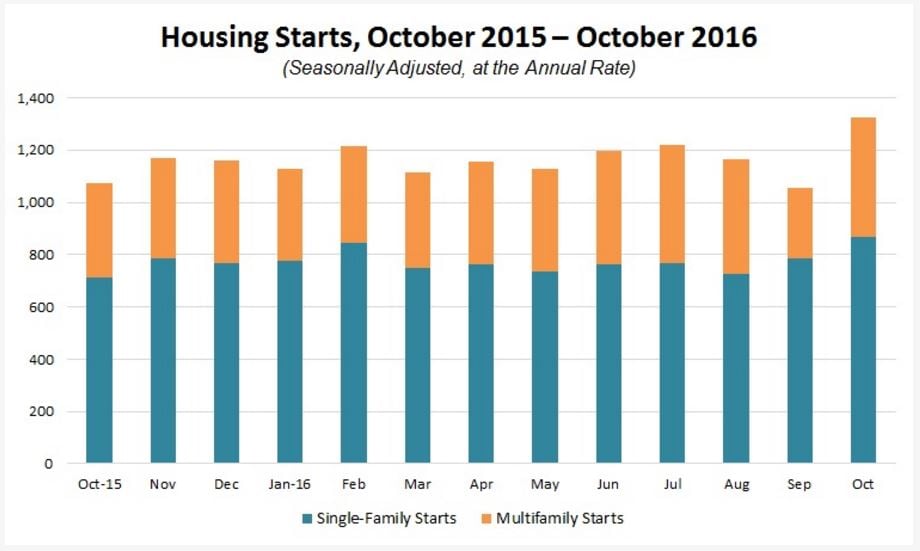
Here again, although the news is that housing starts are at multi-year highs, the chart above shows a “leveling out” of the single-family data over the past year. We expect that level to remain relatively static, and expect the number of new single-family housing starts to run around to 800,000 per month over the next 12 months.
EXISTING HOME SALES
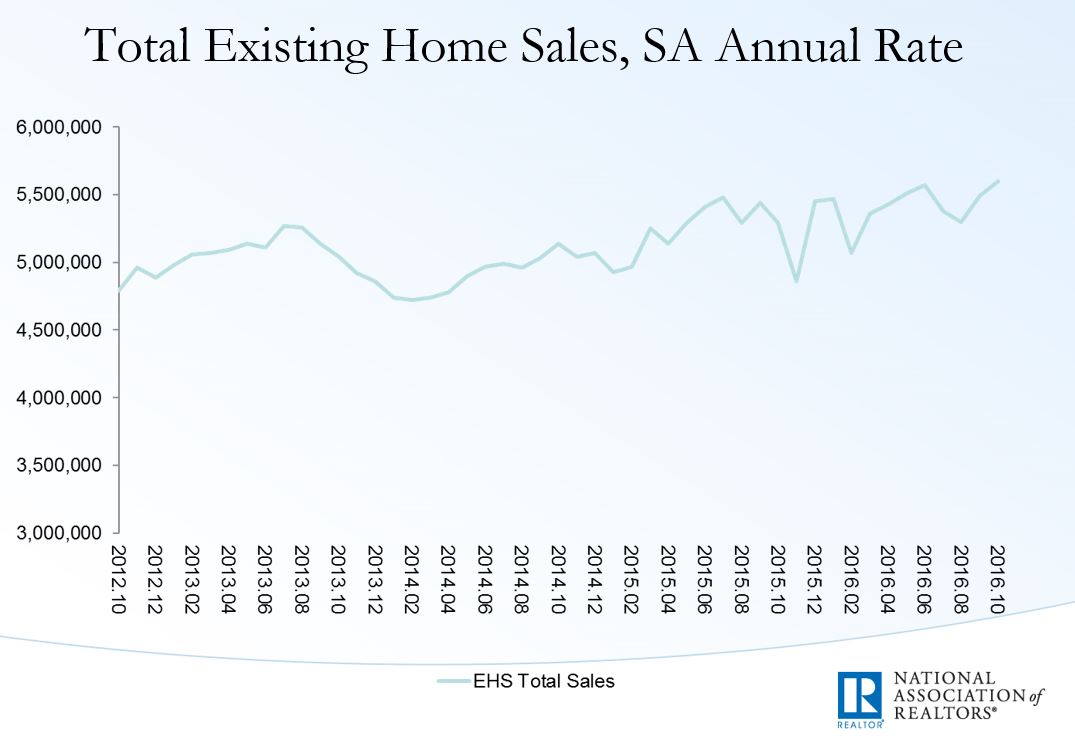
A look at existing home sales from October 2012 to October of this year shows a continuing positive trend line that has grown to around 5.5 million units (annually).
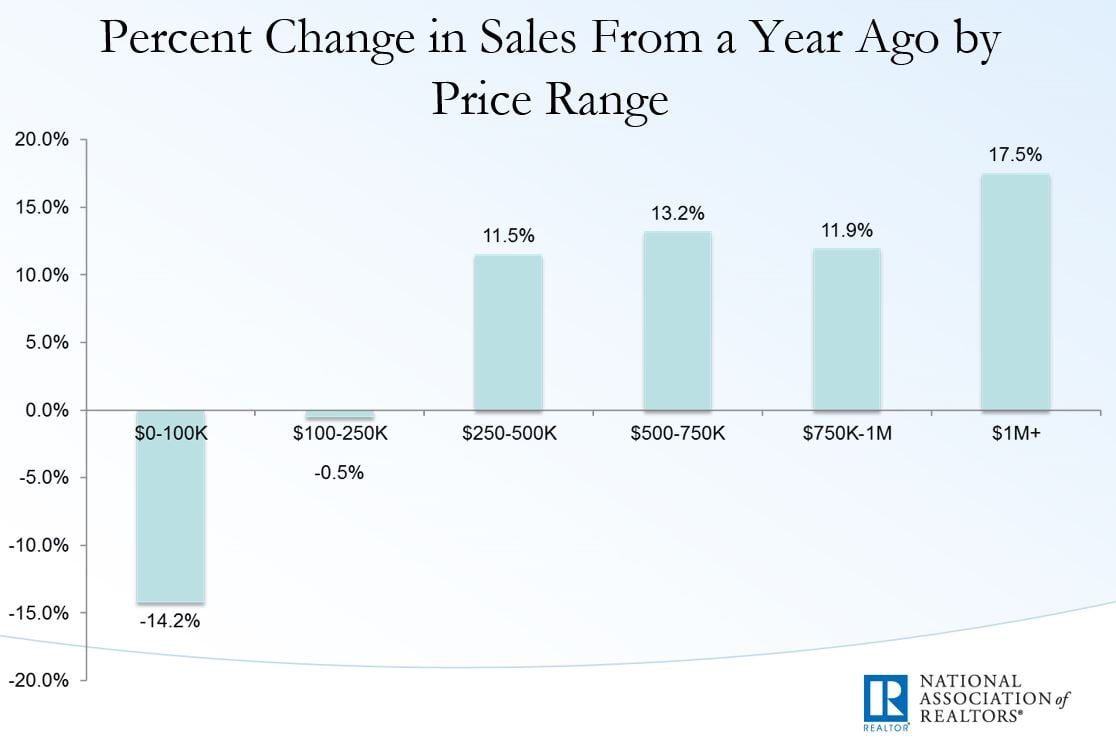
But a closer view of the data showing the percent change in sales BY PRICE RANGE over the past year is lot more revealing. The strong growth has been in homes above $250,000. Home sales for units below $100,000 actually DECREASED 14% year-over-year, and sales of units between $100,000 and $250,000 have been flat:
2016 saw an increase in first-time buyers as more millennials have begun to purchase houses, but there was also a decrease in reported “cash sales” and “distressed sales”:
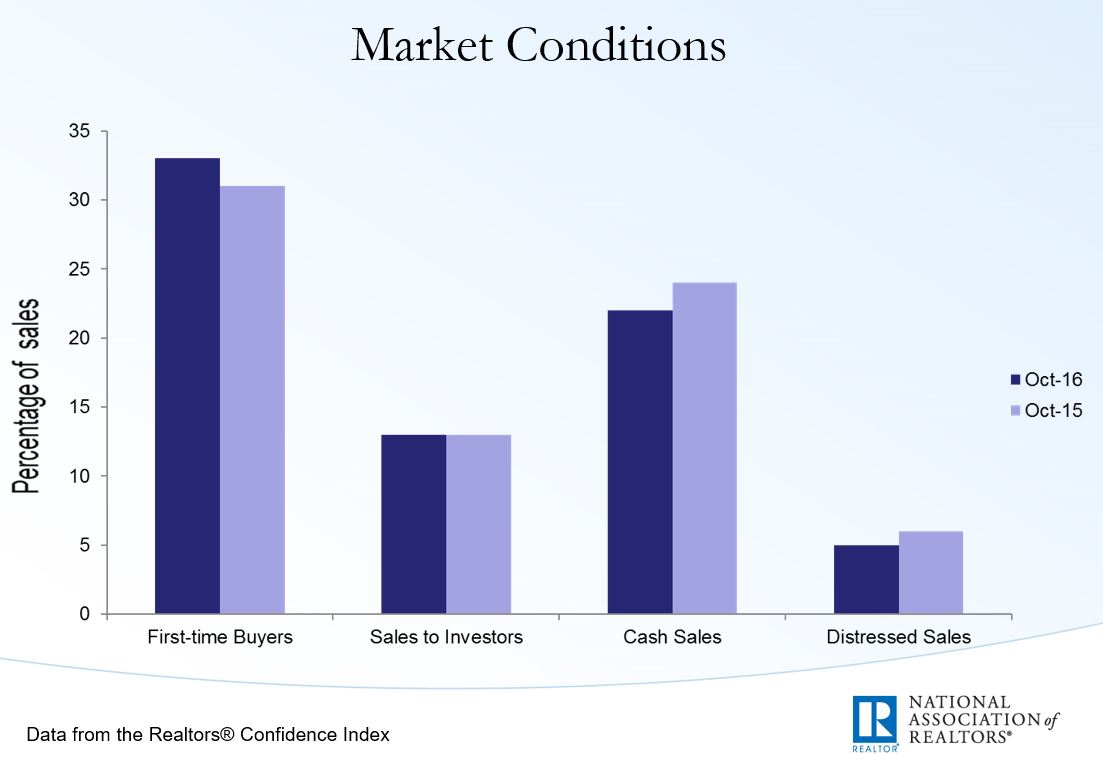
This could indicate that the strong demand for single-family homes (coupled with constraints is supply) in 2016 actually decreased the number of lower-priced homes available for real estate investors to purchase.
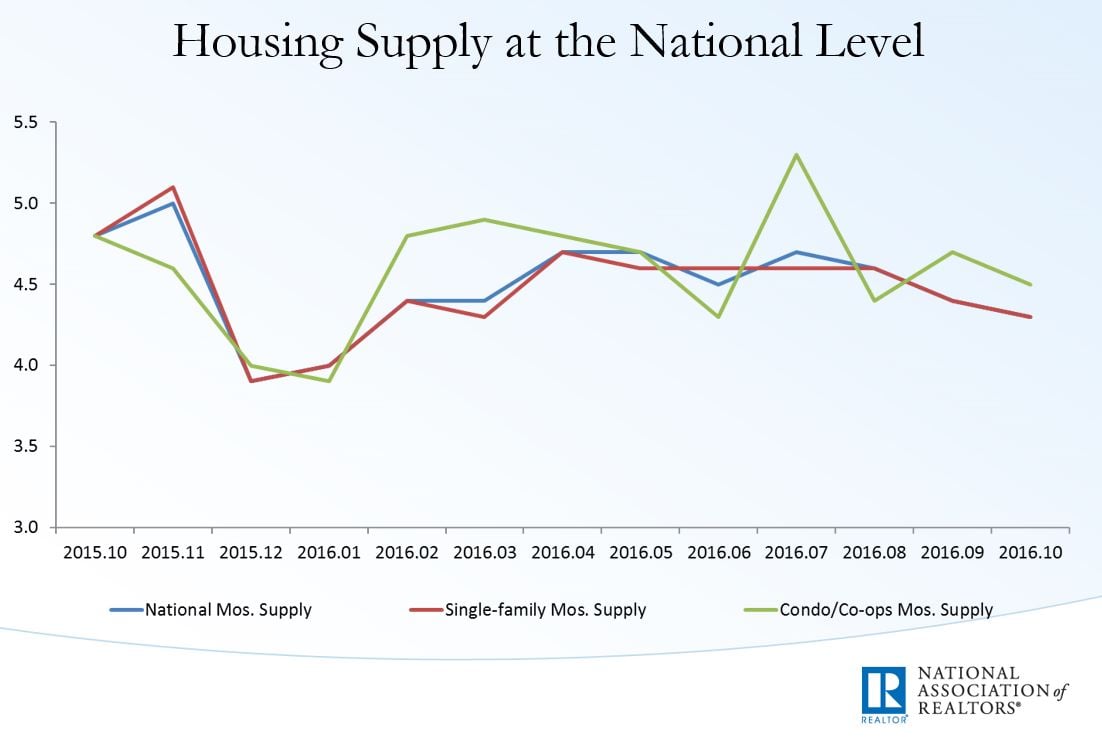
Single-family housing supply levels generally increased over 2016, from less than 4 million units in December 2015 to around 4.5 million units for much of 2016. But housing supply for single-family units continues to run short of demand.
The supply constraints, coupled with strong demand, will continue to edge home prices up in 2017. The drop in sales of houses below $100,000 might be because there are simply fewer houses valued below $100,000 after several years of rising prices. Agents and brokers should benefit from a positive trend in home prices and the number units available at higher price points. However, for real estate investors who focus on single-family housing below $250,000, finding those deals will continue to be a challenge in 2017 as inventories for homes at those price levels will remain very tight.
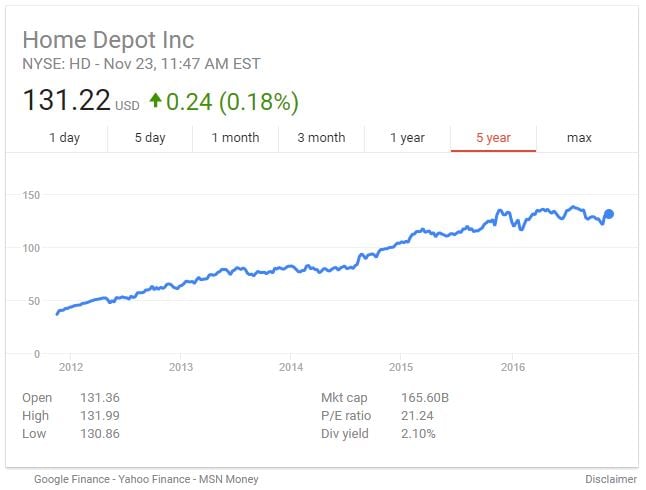
THE HOME DEPOT INDICATOR
OK, so this one is not very “scientific”, but some thing the stock price of Home Depot can be an indicator that money being invested by homeowners and investors to improve houses. As the housing market recovered over the past five years, Home Depot stock has shot up from below $50 in 2012, to over $120 per share a year ago. It now sits at around $131 per share:
But a closer look at the data over just the past 12 months shows that Home Depot has been stuck in a trading range around $130 all year:
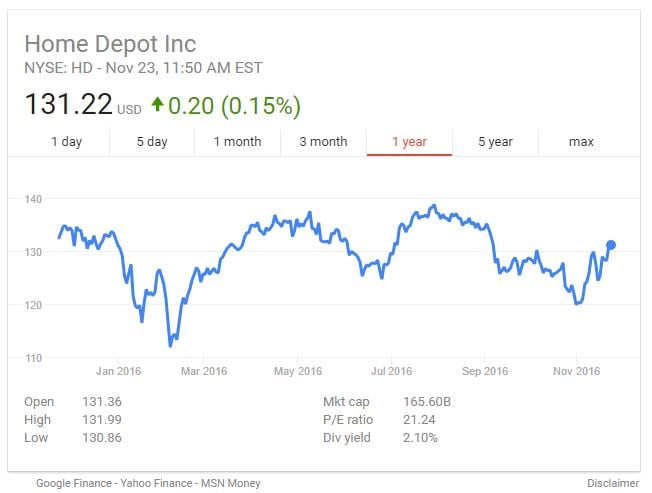
The performance of Home Depot stock over the past year might be indicating that the home improvement market has leveled off a bit in 2016. However, the stock sits at a 5-year high, so interest in home improvement remains very strong as we go into 2017.
IMPACT OF INCREASING INTEREST RATES
The Federal Reserve has indicated that it is likely to increase the federal reserve rate in December, perhaps by 25 basis points, and that they may increase rates a couple of times in 2017. We expect the rate increase in December will happen, and that there will be at least one rate increase in 2017. As a result, we are expecting a 50 basis point (0.5%) increase in the fed funds rate over the next year.
This increase in the underlying rates will push mortgage interest rates up in 2017. In general, increasing mortgage rates could depress home sales. However, rates will still be relatively low historically and demand for housing is expecting to remain strong, so it’s not clear if increasing rates will actually decrease the volume of home sales.
WeBuyHouses.com does not expect any negative impact of rising interest rates (e.g., on existing home sales) unless rates rise above 5% on 2017. And, we believe the Trump administration & the Feds will want to keep rates below 5% next year.
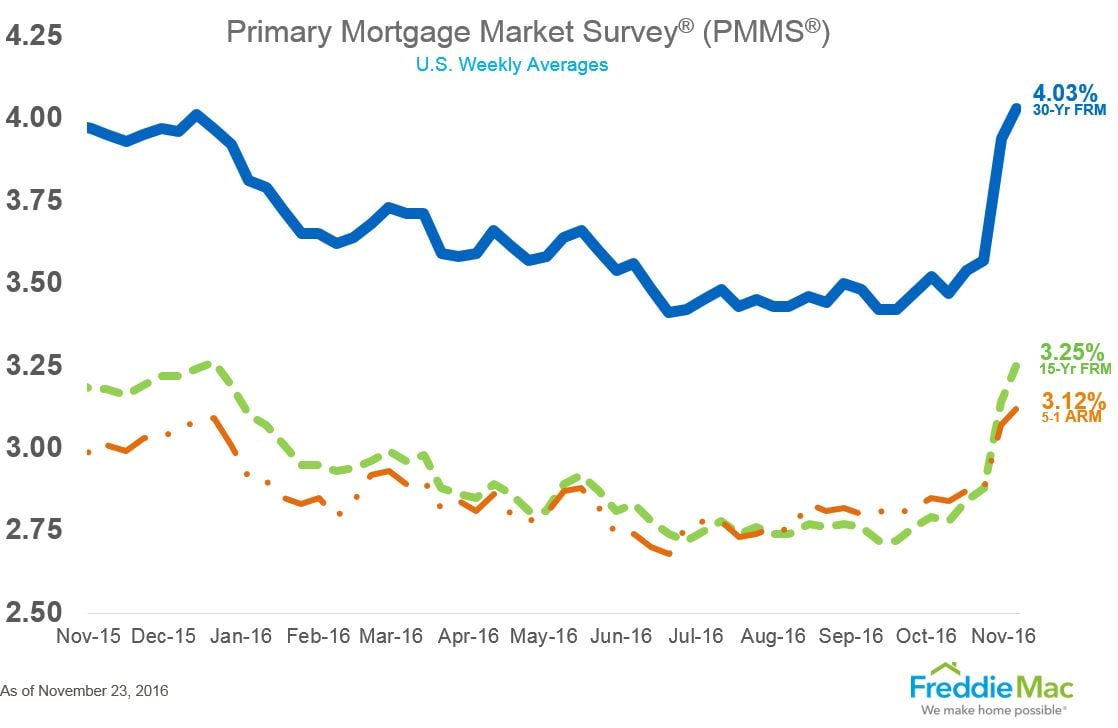
Freddie Mac data over the past year shows that rates are around where they were a year ago.
CHANGES IN REGULATION EXPECTED UNDER TRUMP
As a result of the election of Donald Trump, there is now an expectation that his administration will seek to reduce regulations that affect banking and lending, such as Dodd-Frank.
A loosening of regulations on the banking industry could make it easier for first-time buyers to get a home loan, which could increase demand for housing at the lower end of the price curve (i.e., below $250,000).
We expect that, if a loosening in regulations occurs in 2017, the positive effects of those changes will offset the negative effects of higher interest rates.
CONCLUSION
We see that many of the key housing indicators remained strong but may have also “leveled out” in 2016. We believe this is good for the housing market. Demand for housing has exceeded supply which has driven up prices and, in some cases, pushed investors out of the market. We saw a big upswing in our key housing market indicators from 2010 to 2015. So, a slight leveling off in 2016 shows us that the market may be normalizing – which is necessary to avoid another bubble in the housing market.
In 2017, inventory of existing homes will remain very tight in urban and suburban markets that are in high demand. We don’t see any developments that will significantly increase supply in the next 12-months. Perhaps rising rates – which can cause sales to spike initially – will cool the market off just a bit and help it to reach a point closer to equilibrium in the next year. Regardless, we see another year of rising prices and tight inventories ahead in 2017.